GRR focuses on the percentage of recurring revenue retained from customers, excluding any revenue from upgrades or expansions, while NRR provides a more comprehensive view by including upsell and cross-sell revenues in addition to the retained revenue.
If you lead Finance, FP&A, or revenue operations at a scaling SaaS company, comparing net revenue retention (NRR) and gross revenue retention (GRR) can tell you a lot about the health of your customer base. Both measure revenue from existing customers, but they answer different questions.
NRR includes expansion from upsells and cross-sells, so it can rise above 100 percent. GRR excludes expansion and focuses on how much recurring revenue you retain after churn and downgrades, so it can never exceed 100 percent.
Together, they show how well you retain existing revenue, how much growth comes from your current customer base, and where changes in customer behavior may affect future performance. In this guide, we’ll break down the difference between NRR and GRR, how to calculate each metric, and how workforce planning can support stronger revenue retention as your company scales.
<<Download the SaaS metrics cheat sheet.>>
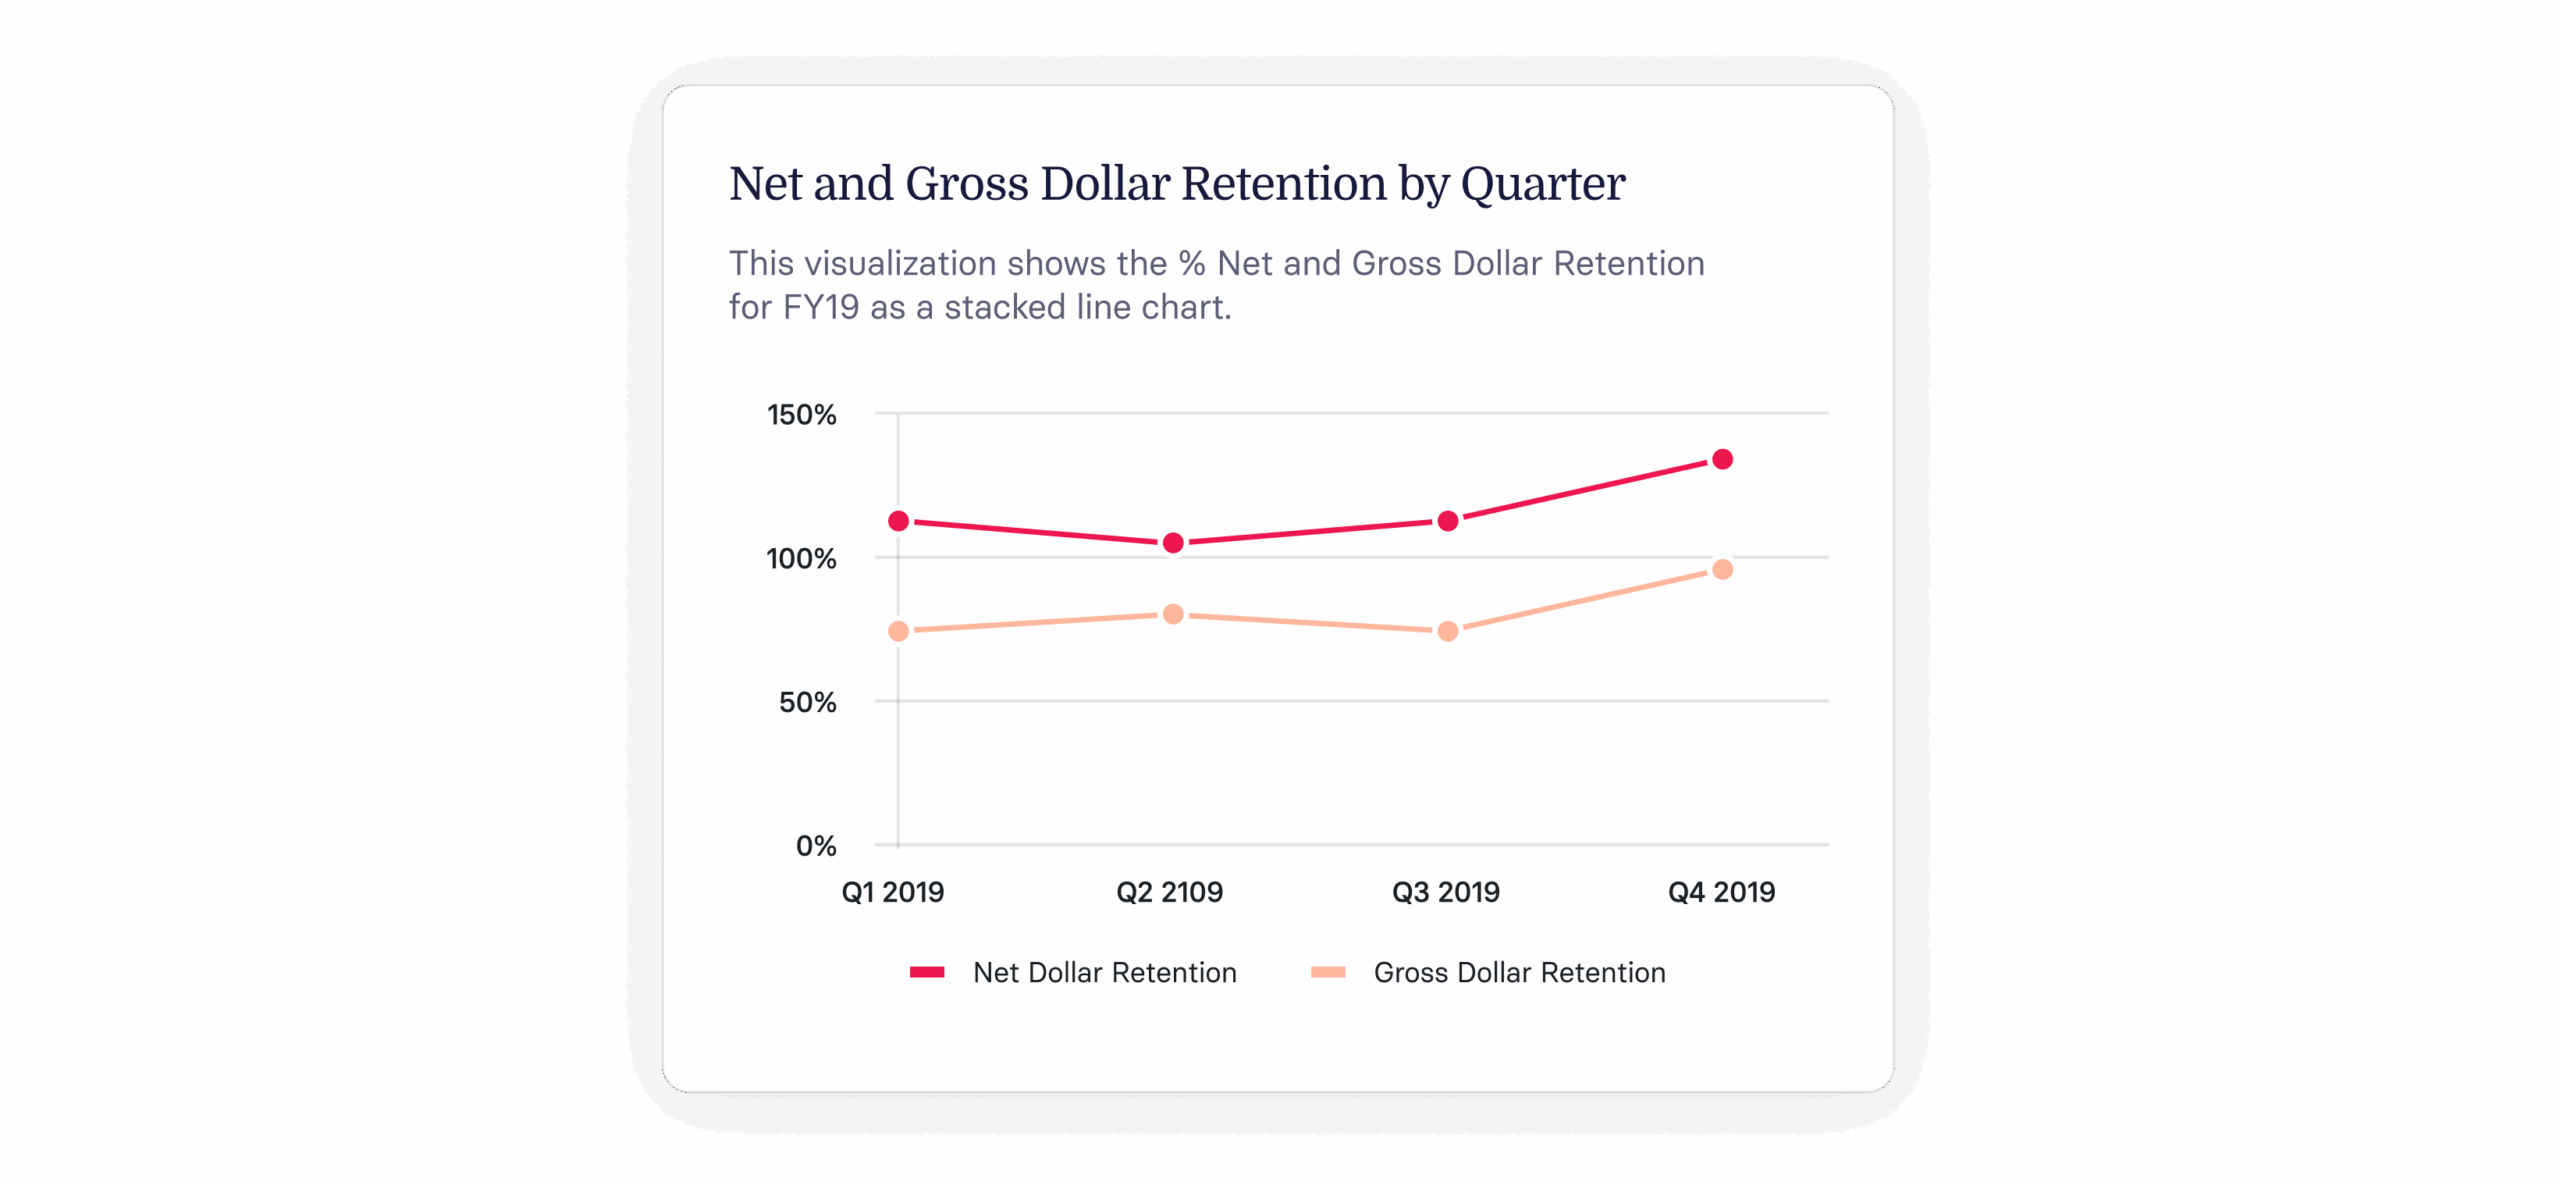
Key insights
- Gross revenue retention (GRR) focuses on the percentage of recurring revenue retained from customers, excluding any revenue from upgrades or expansions, offering a pure measure of customer retention
- Net revenue retention (NRR) provides a comprehensive view by including upsell and cross-sell revenues in addition to retained revenue, indicating both retention and growth
- Both GRR and NRR are crucial for understanding your organization’s ability to preserve and expand its revenue streams
- While GRR is a more conservative metric, NRR can exceed 100 percent, reflecting the additional revenue from existing customers
- Monitoring these metrics helps organizations evaluate customer satisfaction, success strategies, and financial health
- Effective retention strategies focus on enhancing customer success, aligning pricing strategies with value provided, and targeting high-retention customer segments
Net revenue retention vs gross revenue retention: Quick overview
| Metric | Definition | How to calculate | What it’s best for |
| Net revenue retention (NRR) | Recurring revenue kept from existing customers plus expansion from upsells and cross-sells, shown as a percentage | (Starting MRR plus change in MRR) divided by starting MRR, times 100 | Measuring growth within your existing base; can exceed 100 percent |
| Gross revenue retention (GRR) | Recurring revenue kept from existing customers, excluding any expansion revenue, shown as a percentage | (Starting MRR minus churn and downgrades) divided by starting MRR, times 100 | Measuring pure retention and revenue stability; never exceeds 100 percent |
What is net revenue retention?
Net revenue retention (NRR), sometimes called net dollar retention (NDR), compares the change in revenue generated by a cohort of customers from one period to another. NRR accounts for lost revenue from customer attrition or downgrades as well as any increases in total revenue (annual recurring revenue or monthly recurring revenue) over a set period of time.
Get ahead of your top-line planning with this ARR snowball template
How to calculate net revenue retention
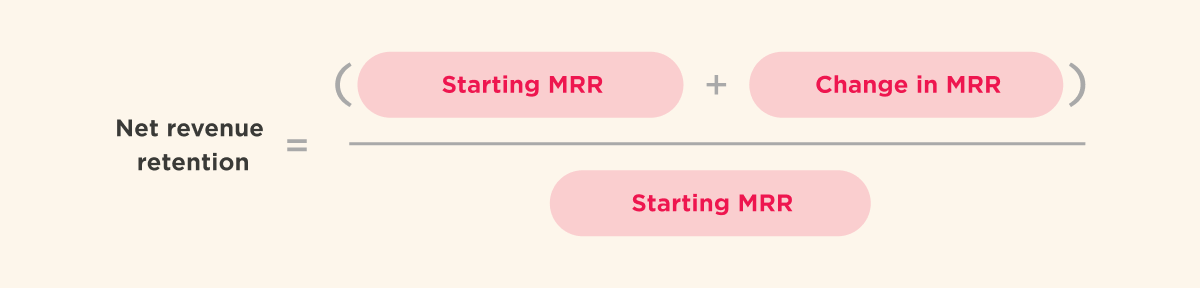
Net revenue retention measures the recurring revenue from your customers over a set period. Net revenue retention rate measures the change from one period to the next.
Net revenue retention formula
NRR = ((Starting MRR + change in MRR) ÷ starting MRR) × 100
There are two basic inputs for a net revenue retention calculation:
- Starting MRR/ARR: The MRR or ARR from the previous period (last month, last quarter, last year, etc.)
- Change in MRR/ARR: Total MRR or ARR change from upsells, downgrades, and churn for the set of customers in your “Starting MRR/ARR” metric compared to the current period.
For the retention calculation, you divide the current monthly or annual recurring revenue (MRR or ARR) for a given cohort of customers by the recurring revenue for that same cohort in a previous time period of the same length—say, last month, last quarter, or last year.
NRR example calculation
Say a cohort starts the month at $100,000 in MRR. Over the period, that cohort adds $15,000 in expansion revenue from upgrades and loses $5,000 to churn and downgrades, a net change of $10,000 ($15,000 − $5,000).
NRR = (($100,000 + $10,000) ÷ $100,000) × 100 = 110 percent
Why does net revenue retention rate matter?
Net revenue retention rate tells you whether your existing customers find enough value to stay and spend more. It accounts for churn and downgrades on one side, and expansion revenue from upsells and cross-sells on the other. If you stopped signing new logos tomorrow, NRR shows how much revenue your current base would still generate next quarter and next year.
That makes it a direct read on sustainable growth. Acquiring a new customer can cost anywhere from five to seven times more than retaining an existing one. And landmark research from Bain & Company found that in financial services, a 5 percent increase in customer retention produces more than a 25 percent increase in profit. Expanding the revenue you already have is often the most efficient growth you can find.
Investors use NRR to gauge SaaS health. Even a small, sustained lift compounds into meaningfully higher ARR over time, since each period builds on a bigger base.
What is a good net revenue retention rate?
A healthy net revenue retention rate depends on your industry, but benchmarks can give you useful anchors. Median NRR for private B2B SaaS sits around 101 percent. Benchmarkit’s data also shows it drifting down from about 105 percent in 2021 to roughly 101 percent in 2023 and 2024.
The 100 percent line is the one to watch. ChartMogul’s analysis of more than 2,500 SaaS businesses found that the median company at or above 100 percent NRR grew 48 percent year over year in the first half of 2024. Above 100 percent means your existing customers generate more revenue each period without any new logos.
NRR tends to rise with deal size. For companies with average contract value (ACV) between $25K and $50K, SaaS Capital’s 2025 survey found a median NRR of 102 percent and a top-quartile NRR of 111 percent. Rates of 110 percent and above are strong.
What is gross revenue retention?
Gross revenue retention (GRR) is a metric that shows the amount of recurring revenue (expressed as a percentage) retained from one period to the next. GRR reflects a company’s ability to preserve its core revenue streams, excluding revenue from enhancements like upsells or cross-sells.
For businesses operating on subscription models, especially in the SaaS realm, GRR is a vital metric spotlighting pure customer retention without the skew of additional revenue avenues.
How to calculate gross revenue retention
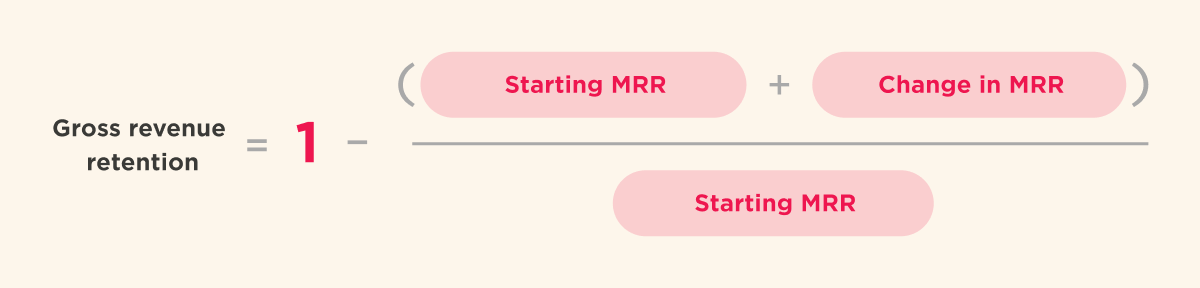
Gross revenue retention is always equal to or lower than net revenue retention, and it can’t exceed 100 percent. The basic calculation is the same as net revenue retention, but the MRR for each individual customer in the current month can’t exceed the MRR for that customer from one year ago (remember, gross retention can factor in downgrades, but not upgrades from your existing customer base).
Gross revenue retention formula
GRR = ((Starting MRR − churn MRR − downgrade MRR) ÷ starting MRR) × 100
Much like the calculation for NRR, gross revenue retention is based on two main inputs:
- Starting MRR/ARR: The MRR or ARR from the previous period (last month, last quarter, last year, etc.)
- Downgrade/churn MRR/ARR: Total MRR or ARR downgrade and churn amounts from the set of customers in your “Starting MRR/ARR” up through the current period.
The complexity of this calculation depends on how you define these inputs. If you have a strong definition of ARR/MRR, upgrades, downgrades, and churn in your organization, calculating NRR and gross revenue retention should be simple.
GRR example calculation
Say a cohort starts the year at $100,000 in MRR. Over the next 12 months, $6,000 churns and another $2,000 downgrades, with no expansion counted.
GRR = (($100,000 − $6,000 − $2,000) ÷ $100,000) × 100 = 92 percent
Why does gross revenue retention rate matter?
By now, you know that gross revenue retention tells you how much revenue you’re holding onto from existing customers over time—while net revenue retention includes growth from upsells and expansions.
Gross retention is especially valuable because it excludes the effects of price increases or account growth. That makes it a more conservative measure—and a stronger indicator of how well you’re retaining revenue from your current customer base, without relying on additional sales to offset churn.
What is a good gross revenue retention rate?
GRR can never exceed 100 percent, so benchmarks look different. According to Benchmarkit’s 2025 report, median GRR for private B2B SaaS slipped from about 90 percent in 2022 to about 88 percent in 2024. SaaS Capital’s 2025 survey puts the median at 91 percent across the private SaaS companies it surveyed.
GRR naturally scales upward with contract size, as larger enterprise clients typically commit to longer, more stable agreements. For a standard private SaaS company, a GRR in the high 80s to low 90s signals a healthy, stable customer base. The closer your retention inches toward 100 percent, the less new sales revenue your team needs to maintain a flat growth line.
The challenges of tracking revenue retention rates
Tracking retention rates is the straightforward part. If you know each account’s current value and how it compares to last month or last year, the math is simple. The harder part is understanding the story behind the number.
Here are the challenges teams run into most, and how to get around them:
| Challenge | How to avoid it |
| Data scattered across systems | Bring HR and finance data into one source. HiBob’s Budget Smart, People Fair report found just 2 percent of people managers have a unified HR and finance dashboard today. |
| Inconsistent metric definitions | Agree on shared definitions for ARR, MRR, upgrades, downgrades, and churn before you calculate, so NRR and GRR stay comparable from period to period. |
| Slow, manual data assembly | Automate reporting instead of stitching spreadsheets. HiBob found 60 percent of people managers spend three or more hours assembling data before a people decision. |
| Retention read without context | Track NRR and GRR alongside CAC, LTV, and headcount so you see why the numbers move, not just that they moved. |
| People and finance goals pulling apart | Align on shared targets. HiBob found 32 percent of people managers cite conflict between people and financial goals as a top obstacle. |
Revenue retention never stands alone. A strong NRR can mask a low GRR, which tells you what happens if a wave of customers downgrades over the next 12 months. Losing 10 customers at $10,000 each looks different from losing one worth $150,000 once you weigh customer acquisition cost (CAC) and customer lifetime value (LTV).
This is where a unified platform earns its keep. With HiBob, HR and finance teams work from the same real-time people and cost data, so the numbers behind your retention rates line up and the story behind them gets easier to tell.
Recommended For Further Reading
How proper workforce planning supports revenue retention
Revenue retention is not only a Finance metric. The teams that renew and expand accounts, including customer success, support, and onboarding, are staffed, budgeted, and planned by people. When workforce planning aligns with revenue goals, retention has room to grow.
Customer success capacity is a good example. If your book of business grows faster than your CS headcount, coverage thins and at-risk accounts can slip through, putting pressure on both GRR and NRR. Planning headcount and budget against expansion targets helps keep the teams that protect revenue ahead of demand.
This is where HR and Finance alignment pays off, and where HiBob helps. With one connected view of headcount, workforce costs, open roles, and planning data, HR and Finance can model hiring needs against revenue goals, spot capacity gaps earlier, and make faster decisions about where to invest. That gives teams a clearer path to scale without losing sight of the people and resources that support retention.
Stay updated
Get the latest HR tips and insights in our monthly newsletter.
NRR and GRR FAQs
Your net revenue retention rate (NRR) uses changes in ARR/MRR (including upsells, downgrades, churn, and renewals) to show revenue growth from your existing customer base. It helps you understand the momentum of your SaaS business and its path to overall profitability. Gross revenue retention (GRR) doesn’t factor in expansion revenue, instead focusing solely on downgrades, non-renewals, and revenue churn rate. That means GRR is a more conservative metric that can never exceed 100 percent (unlike NRR, which should ideally be well over 100 percent).
Increasing net revenue retention is all about thinking beyond new business bookings to focus not just on how you retain customers — but also on how you continue to earn more money from your customer base year after year. There are many different ways that SaaS companies can achieve a higher NRR, including:
- Improving overall logo retention by investing in customer success, mapping product roadmaps to customer pain points, and improving support experiences.
- Updating your SaaS pricing strategy to better align with the value you provide to customers and include natural expansion and upsell opportunities at renewal.
- Revising go-to-market strategies to focus more resources on customer segments that have higher net revenue retention rates (i.e., certain industries, companies demographics, product lines, etc.).
- Gaining deeper insight into relevant metrics like LTV and CAC so leadership can assess product-market fit and make more proactive strategic decisions.
Neither metric wins on its own; they answer different questions. GRR shows how well you hold onto revenue without any expansion, so it is the more conservative floor. NRR shows retention plus growth from your existing base. Read together, GRR tells you how stable your revenue is, and NRR tells you how fast it grows on its own. Most finance leaders track both.
Net dollar retention (NDR), which is another term for net revenue retention (NRR), is a metric that measures changes in recurring revenue between two different periods. Businesses can calculate NDR on a monthly basis using monthly recurring revenue (MRR) as the base metric, or on an annual basis using annual recurring revenue (ARR) as the base metric.
The formula to calculate net revenue retention is starting MRR plus the change in MRR divided by Starting MRR. Starting MRR (or ARR) is MRR/ARR from the previous period. Change in MRR/ARR is the change in MRR/ARR from upsells, downgrades, and customer churn.
The formula to calculate gross revenue retention is churn MRR plus downgrade MRR divided by starting MRR. Downgrade and churn MRR/ARR are your Starting MRR/ARR values minus downgrade and churn (or customer attrition) amounts from your customer sets.