Free cash flow (FCF) is operating cash flow minus capital expenditures (CapEx). It helps show a company’s capacity to reinvest, repay debt, or return cash to investors.
Free cash flow (FCF) is one of the most direct signals of whether a business can fund itself. At its simplest, you calculate free cash flow as operating cash flow minus capital expenditures (CapEx). That single figure helps you assess the business’s capacity to reinvest, pay down debt, or return to investors.
This article walks through how to calculate free cash flow and free cash flow margin, how levered and unlevered FCF differ, what counts as “good” free cash flow, and how to track this financial metric.
<<Download the SaaS metrics cheat sheet today!>>
Key insights
- Free cash flow measures the cash a business generates from operations after capital expenditures
- The simplest formula is operating cash flow minus CapEx
- Unlevered FCF (FCFF) measures cash for all capital providers; levered FCF (FCFE) measures the cash available to equity holders after interest and net borrowing
- Free cash flow margin shows how much of a company’s revenue converts into free cash flow
- A “good” FCF depends on industry, growth stage, and strategy, with the Rule of 40 offering one widely used benchmark
What is free cash flow?
Free cash flow is operating cash flow minus capital expenditures (CapEx). Operating cash flow reflects the cash effect of day-to-day costs like payroll, rent, and insurance, while CapEx covers investment in long-term assets like equipment and property. The result helps show a company’s capacity to reinvest, repay debt, or return cash to investors.
Leadership teams look at free cash flow when deciding whether to pay down debt, distribute dividends, or pursue acquisitions. As a company grows and nears an IPO, free cash flow becomes a key indicator for investors and lenders weighing its strength against net income alone.
Free cash flow is typically reported annually in 10-K filings, though many companies also share it quarterly in 10-Qs.
How is free cash flow calculated?
There are a few ways to calculate free cash flow, but they don’t always produce the same figure.
The simplest approach is to start with your operating cash flow from the cash flow statement and subtract capital expenditures (CapEx).

The simple formula is the best starting point whenever you have a finished cash flow statement, because both inputs are already there and the math is hard to get wrong.
A related formula starts from the income statement and balance sheet instead. It makes sense to use if you don’t have a cash flow statement yet, like when you’re building a forecast or modeling a private company, or when you want to see how operating profit, taxes, and reinvestment each drive the result. It calculates free cash flow to the firm (FCFF), a valuation measure that’s related to, but not interchangeable with, the FCF a company reports:
- Starting with operating profit (EBIT) after tax, adding back depreciation, then subtracting investment in fixed capital and working capital
- The formula: EBIT × (1 − tax rate) + depreciation − fixed capital investment − working capital investment = FCFF
Free cash flow example calculation
Say a company reports operating cash flow of $500,000 for the year and spends $120,000 on capital expenditures. Its free cash flow works out to $380,000:
$500,000 − $120,000 = $380,000
Levered vs. unlevered free cash flow
When someone refers to “FCF,” they might mean one of two related measures—and the difference changes how you read the number.
Unlevered free cash flow, also called free cash flow to the firm (FCFF), is the cash available to all of a company’s capital providers before it makes debt payments. Levered free cash flow, or free cash flow to equity (FCFE), is the cash available to equity holders after interest payments and net borrowing (new debt raised minus principal repaid). The formulas assume interest paid is included in operating cash flow, as it is under United States GAAP.
| Unlevered FCF (FCFF) | Levered FCF (FCFE) | |
| Who it’s for | All capital providers, debt and equity | Equity holders only |
| Relative to debt | Before debt payments | After interest and net borrowing |
| Simplified formula | Operating cash flow + interest expense × (1 − tax rate) − CapEx | Operating cash flow − CapEx + net borrowing |
FCFF shows the cash the core business produces regardless of how it’s financed, while FCFE reflects the cash available to shareholders after interest, debt repayments, and any new borrowing.
Why free cash flow matters
Two key perspectives explain why free cash flow (FCF) matters: internal and investor-facing.
Internally, FCF helps finance teams and leadership understand how much flexibility the business has to reinvest. Do you have enough available cash to develop new products, expand into new markets, or acquire another company? Can you support buybacks or dividends to keep shareholders engaged? These decisions hinge on clear visibility into your free cash flow.
From the investor’s perspective, FCF offers a snapshot of your company’s financial health. It’s often used as a starting point to evaluate profitability and assess how well your business generates value.
Investors want to see free cash flow put to work: fueling growth, innovation, or returns. That doesn’t mean FCF must always be positive, but it does mean you need to show how profits are being strategically invested to move the business forward.
Free cash flow also tells a different story than net income. Net income follows accrual accounting and can include non-cash items like depreciation, while free cash flow tracks the actual cash a business generates. That difference can reveal liquidity the income statement obscures, which is why many investors treat free cash flow as a more grounded measure of financial strength.
<<Build the right narrative with this free board deck template.>>
What is free cash flow margin?
Free cash flow margin shows how much of a company’s revenue converts into free cash flow—and it’s a useful indicator of how efficiently a business manages both its operating expenses and capital investments.
Calculating and interpreting free cash flow margin
To calculate free cash flow margin, divide your free cash flow by total revenue, then multiply by 100. The result shows the percentage of each dollar of revenue that remains as free cash flow—offering a clear view of your company’s financial efficiency.
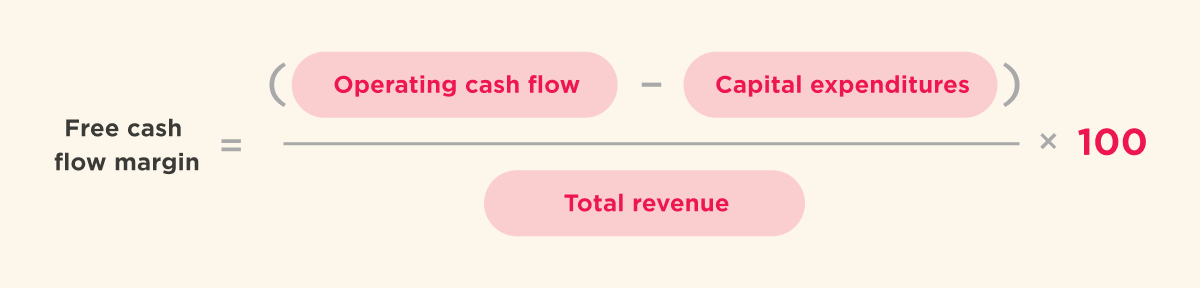
A higher free cash flow margin means more cash was generated relative to revenue in that period. On its own, it doesn’t prove a business is healthy, since the timing of collections, payments, or capital spending can move it, so look at what drove any change. It’s a close cousin of gross margin, but where gross margin stops at production costs, free cash flow margin captures capital spending too. Tracking the trend over time shows whether efficiency improves as the business scales.
Free cash flow margin example calculation
Using the earlier figures, imagine that same company generated $2,000,000 in total revenue and $380,000 in free cash flow. Dividing free cash flow by total revenue and multiplying by 100 gives a free cash flow margin of 19 percent:
$380,000 ÷ $2,000,000 × 100 = 19 percent
In practice, that means 19 percent of the company’s revenue converted into free cash flow.
Why free cash flow margin matters
In financial analysis and investor evaluation, free cash flow margin offers a more nuanced view than free cash flow alone. It shows not just how much cash your business generates, but how efficiently that cash is produced in relation to revenue. This level of insight is especially important in industries where controlling operational and capital costs is critical to long-term profitability.
What’s considered “good” free cash flow?
While free cash flow can reveal a lot about a company’s financial health, what qualifies as “good” depends on your industry.
Some investors and analysts judge free cash flow and free cash flow margin alongside growth, capital needs, debt commitments, and cash reserves. But as always, context matters: what’s “good” should align with your growth stage, financial strategy, and long-term goals.
One widely used way to frame the question combines growth and profitability. The Rule of 40 holds that a healthy software company’s revenue growth rate plus its profit margin adds up to at least 40 percent. That 40 percent is a combined score, not a target for margin on its own: a company growing quickly can meet it with a low or even negative margin. Bessemer Venture Partners’ Atlas applies a similar lens with its efficiency score, defined as free cash flow margin plus year-over-year annual recurring revenue (ARR) growth rate. Bessemer notes that the Rule of 40 is often read as an efficiency score of 40 percent or more, and that in its analysis of cloud companies, the BVP Nasdaq Emerging Cloud Index average was closer to 50 percent.
Both figures are historical benchmarks, so treat them as a way to see how investors weigh growth against cash generation rather than a current target.
Challenges in tracking free cash flow
Free cash flow is a useful measure of financial health, but it can be difficult to track and interpret consistently. These are some of the most common challenges and how Finance teams can address them.
| Challenge | What can go wrong | How to address it |
| Limited visibility | FCF is not always reported consistently, so it can get lost behind metrics like revenue and net income | Track it regularly in internal dashboards alongside other core financial metrics |
| Investment can look like decline | A drop in FCF may reflect planned investment rather than weaker performance | Explain major changes so strategic spending is not mistaken for deterioration |
| No standard definition | FCF is a non-GAAP metric, so calculations can vary between companies. SEC non-GAAP guidance reflects this | Use a consistent formula and add context that explains what is moving the number |
| Uneven capital spending | Large one-time CapEx can distort FCF in a single period | Separate one-off investments when comparing performance over time |
| Manual reporting | Pulling data together by hand takes time and increases the risk of errors | Automate data collection where possible so Finance can spend more time on analysis |
These challenges compound when data is hard to reach. In HiBob’s research, 66 percent of people managers say that when data is time-consuming to access, they default to an educated guess rather than miss a deadline. For a metric as nuanced as free cash flow, closing that gap between guesswork and grounded analysis is exactly what strong reporting delivers.
<<Streamline your financial modeling process with this template.>>
Recommended For Further Reading
Get a clearer view of your company’s health with smarter free cash flow tracking
Free cash flow gives you a clear read on financial health, and the hiring and spending decisions that move it are easier to plan when the data behind them is connected. When people data and financial data live in separate systems, that view arrives late, and finance leaders end up reacting instead of planning ahead. The payoff shows up in the data: 82 percent of people managers say they’d make more cost-effective decisions with timely, unified HR and finance data.
HiBob’s Finance Suite brings people and financial data together in one place, so finance and FP&A teams can model how headcount and spending decisions affect cash flow. Finance and HR teams can sync live people data into collaborative department budgets, build connected three-statement models, and track vendor spend against budget. That unified view helps leaders move from educated guesses to confident, data-backed decisions.
Ready to get a clearer view of your company’s financial health?
Book a demo to see how HiBob’s Financial Planning suite unifies your people and financial data.
Free cash flow FAQs
Free cash flow plays an essential role in valuation as it shows how much capital a company has available to invest in growth, pay off its debts, or return dividends to investors, which is an indicator of financial health that investors use to determine its present value.
EBITDA is a measure of a company’s operating performance and profitability, excluding taxes, depreciation, and amortization. It’s often used to compare performance across businesses, as it strips out certain non-operating expenses.
Free cash flow (FCF), on the other hand, shows the actual cash generated from operations—what’s left after covering capital expenditures. It helps show a company’s capacity for reinvestment, debt repayment, or dividends. While EBITDA highlights operating efficiency, FCF offers a clearer view of a company’s ability to generate and manage cash in real terms.
Working capital is current assets minus current liabilities. It reflects the company’s ability to meet short-term obligations.
In FCF analysis, changes in operating working capital affect operating cash flow: for example, more cash tied up in receivables can reduce it. Understanding these changes helps give a clearer picture of how much cash is actually available for reinvestment or other strategic decisions.
Free cash flow isn’t automatically good or bad. Consistent positive free cash flow signals that a company can handle costs, invest in growth, or return value to investors without leaning on outside financing. Negative free cash flow isn’t necessarily a red flag either, since fast-growing companies often invest heavily in expansion, which can temporarily push it negative. The context behind the number matters more than its sign.
Definitions of FCF yield vary. The equity-focused version divides free cash flow to equity (FCFE, or levered FCF) by market capitalization, while the unlevered version divides free cash flow to the firm (FCFF) by enterprise value. There’s no single target level, since a healthy FCF yield varies by industry and growth stage, though a higher yield generally suggests a company generates more cash relative to its valuation. Wall Street Prep notes there is no single levered FCF yield that investors or operators target, because returns vary by industry.